Archive
Monitoring SAN Performance with SCOM 2012
Monitoring SAN performance is on everyone’s list of essential monitoring requirements. When it comes to monitoring the SAN, the most important question is what perspective will provide the most accurate data? For example, monitoring a website directly from the server hosting the website will not likely provide a good indication of what end users may be experiencing.
The same can be said for SANs. You can monitor the performance of the SAN from the perspective of the SAN but will that accurately represent the experience of the end users – and in the case of SANs – the end users are the servers using the SAN.
I always monitor storage from the perspective of the servers. We deal with this subject on a daily basis and employ a simple, yet effective, solution for monitoring our customer’s storage technology – regardless of vendor. It is highly customizable and flexible and ensures transparency into the performance of your SAN.
This blog has two purposes: First is to clearly demonstrate I have no desktop publishing skills at all and second, to walk thru how to monitor the performance of typical SAN storage, specifically, storage not presented as logical disks (c:\, d:\ etc.) to the server. We will implement monitoring of two separate LUNS residing on a small SAN connected to a 3 node Hyper-V failover cluster and build a corresponding dashboard.
Physical Disks
So how do you monitor disks that appear to be invisible because the disks don’t have a logical drive letter? Its actually very easy – you simply need to configure SCOM 2012 to discover the underlying physical disks. Once you can “see” them, monitoring is a snap.
Scenario
The environment consists of a 3-node Hyper-V failover cluster running Windows Server 2008 R2 SP1. It is comprised of:
Components
1- 3 x Dell PE R610 Servers
2- Dell MD3200 PowerVault
3- 6 x SAS 7K RPM 500 GB – RAID 5
4- 6 x SAS 15K RPM 300 GB – RAID 10
5- The RAID 5 LUN hosts a CSV for non-production virtual servers.
6- The RAID 10 LUN hosts a CSV for production virtual servers.
Monitoring Objectives
We want to monitor the performance of both CSVs and collect the following performance metrics:
Metrics
1- Write Bytes Per Second
2- Read Bytes Per Second
3- Disk Reads Per Second
4- Disk Writes Per Second
5- Average Disk Seconds Per Transfer
physical disk performance counters available in SCOM 2012. An * denotes the performance collection rule is enabled by default; all others must be explicitly enabled via an override.
1- Performance Counters
2- % Physical Disk Idle Time 2008
3- Average Physical Disk Read Queue Length 2008
4- Average Physical Disk Write Queue Length 2008
5- Physical Disk Average Disk Queue Length 2008
6- Physical Disk Average Disk Queue Length 2008
7- Physical Disk Average Disk Seconds per Transfer 2008*
8- Physical Disk Average Disk Seconds per Write 2008
9- Physical Disk Current Disk Queue Length 2008*
10- Physical Disk Bytes per Second 2008
11- Physical Disk Read Bytes Per Second 2008
12- Physical Disk Reads per Second 2008
13- Physical Disk Split I/O Per Second 2008
14- Physical Disk Write Bytes Per Second 2008
15- Physical Disk Writes per Second 2008
1. Create a New Management Pack
For this effort. Lets call it ‘CSV Performance’
2. Configure SCOM 2012 to Discover the Physical Disks
This will ‘expose’ the disks making them available to be monitored by SCOM 2012. You could enable the discovery for all servers but I recommend explicitly enabling discovery only for the servers whose disks you want to monitor:
3. Create a New Group
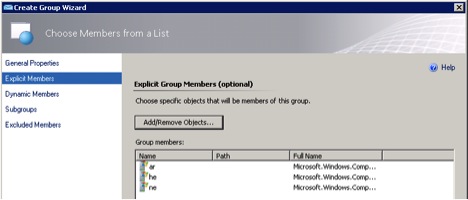
This group will contain the servers, which make up the cluster. It is these servers that have access to the SAN disks. Physical disk discovery will be enabled for this group. Let’s call it ‘Cluster Nodes’. Be sure to save it to the ‘CSV Performance’ management pack. Also, when adding the servers to the group, be sure to search for type ‘Windows Computer’. See Figures A & B
Figure A:
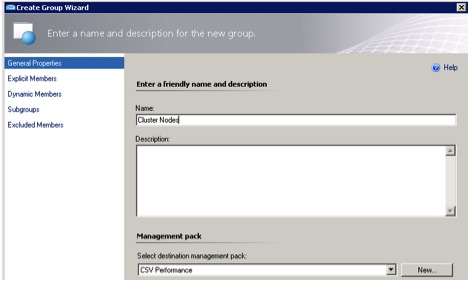
Figure B:
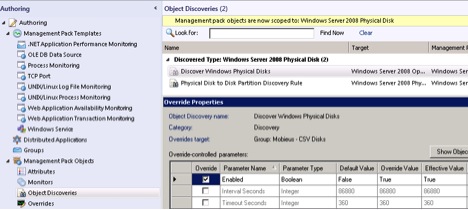
4. Turn on Physical Disk Discovery
This is done in ‘Authoring / Management Pack Objects / Object Discoveries’. Change scope to ‘Windows Server 2008 Physical Disk’. The name of the discovery rule is ‘Discover Windows Physical Disks’. Override the discovery rule for the group ‘Cluster Nodes’. Discovery may take up to 24 hours but usually will take much less time. Save the override to the CSV Performance management pack. See Figure C:
Figure C:
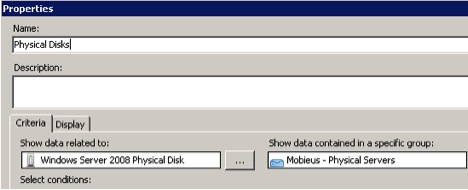
5. Verify the Disks were Discovered
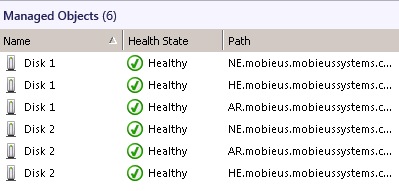
Create a new ‘State’ view in ‘My Workspace’. When creating the view, select ‘Windows Server 2008 Physical Disk‘ for the ‘Show data related to:’ field and ‘Cluster Nodes’ for ‘Show data contained in a specific group:’ Lastly, be sure to personalize the view and choose ‘Model’. See Figure D:
Figure D:
If discovery completed successfully, you will be presented with a view similar to:
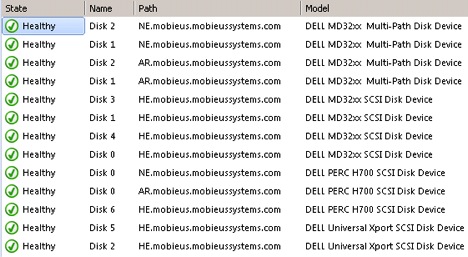
In our environment, each node has 3 internal disks, RAID 5. This accounts for 9 of the disks. The 3rd node of the cluster is in reserve; it owns no resources so only 2 nodes have access to each CSV accounting for 4 more disks for a total of 13.
So now we need to identify which disks are our SAN disks. In this case, the SAN disks are those with a Model name of ‘Dell MD32xx Multi-Path’. We have now isolated the two disks (LUNS) we want to monitor, Disk 1 and Disk
You will also want to know which CSV is hosted on which disk. You can use the Failover Cluster Manager utility to do this by mapping capacity to volume number.
6. Create another group called ‘CSV Disks’
Populate it with Disk 1 and Disk 2. Again, save it to the CSV Performance management pack created earlier.
A. Go to ‘Authoring / Groups’ and create a new group called ‘CSV Disks’
B. Navigate to ‘Explicit Members’ / ‘Add/Remove Objects…’ and select ‘Windows Server 2008 Physical Disk’ in the ‘Search for:’ field.
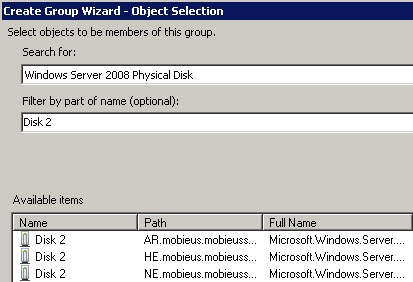
C. In the ‘Filter by part of the name (optional):’ enter Disk 1 (or whatever disk number corresponds to your environment) and add the items returned. The path should be the name of the server whose disks you want to monitor. Repeat for Disk 2. See Figures E & F:
Figure E:
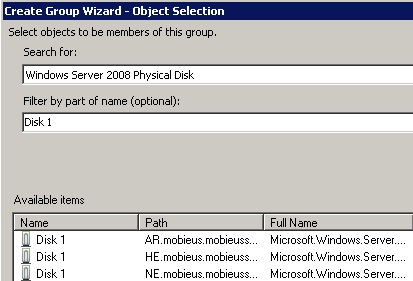
Figure F:
D. Add Disk 1 and Disk 2 for all applicable nodes:
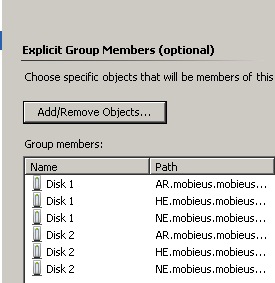
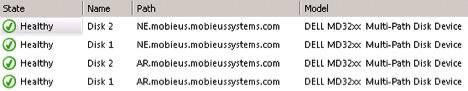
Now we have exposed the correct drives and neatly grouped them in a group called ‘SAN Disks’. See Figure G:
Figure G:
7. Enable the Performance Counters
Go to ‘Authoring / Management Pack Objects / Rules’ and change the scope to ‘Windows Server 2008 Physical Disks’. See Figure F:
Figure F:
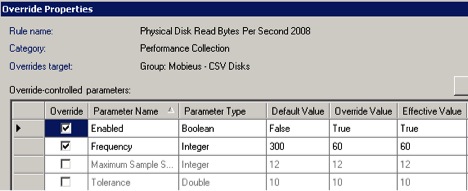
earlier in this blog lists all physical disk performance counters available in SCOM 2012. They must be explicitly enabled via an override, which targets the group called CSV Disks, which should be stored in the CSV Performance management pack. Those underlined are the ones we will be using. Figure F also shows we changed the sampling frequency to 60 seconds.
8. Verify Performance Data is Being Collected
You can create a ‘Performance’ view in ‘My Workspace’ using the same values used for the ‘State’ view created earlier. See Figure G & H:
Figure G:

Figure H:

9. Create New Dashboard
Choose ‘Grid Layout’ and give it a name. Let’s call it ‘Cluster Disk Performance’. Choose ‘5 Cells’ and a layout template of your choosing then click ‘Create’.
A. For each cell, add a Performance widget
B. Use a name similar to the performance metric so for the first cell, lets use ‘Disk Writes/sec’
C. For ‘group or object’, select the ‘CSV Disks’ group created earlier.
D. For performance counter, ‘PhysicalDisk’ will be the only item available in the dropdown then select the ‘Disk Writes/sec’ counter.
E. Choose a desired time range and legend values.
F. Repeat for the other 4 performance counters.
Sample Dashboard for SAN Performance

I have been having a lot of struggles (as you have seen) with formatting so click HERE for a better image:
Please note the columns in the legends or your dashboard are sortable. Just click on the field name, say Average Value, and it will sort ascending or descending. IMHO this one simple feature is what makes the dashboards in SCOM 2012 super useful.
This blog focused on disk performance but I want to point out the when working with CSVs, capacity is also a crucial metric. Fortunately the Windows Server management pack provides capacity metrics for Cluster Shared Volume Disk Capacity. You can easily modify your dashboard to incorporate this metric.
How to get Knowledge Editing to work in Operations Manager 2012 with Office 2010
How to get Knowledge Editing to work in Operations Manager 2012 with Office 2010 here
Making Alert Processing Rules More Useful in SCOM 2012
More often than not, the most useful information in an Event is in its Description. Alert Generating Rules (AGRs) are easy to create but I often find information is not in the most convenient location and a few additional mouse clicks are needed to find it. What can I say, I am lazy.
For example, let’s consider Windows Security event 4740. It is generated whenever a user account is locked out. You can easily create an AGR for event ID 4740 from the Security log. 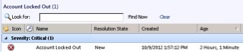
Kinda’ useful except in order to find out What Account was locked out and from which computer it was locked out I need to open the Alert. When viewing Alerts in a NOC or any environment using heads up displays, chances are the view is locked. It would be more efficient if the critical pieces of data were available without any additional mouse-clicks. What you need when you need it.
This is actually very easy to do in Windows Server 2008. The AGR needs to be modified to ‘expose this data in the available Custom Fields. In order to do this, we need to figure out how the data in the Description field maps to the event specific Parameters the AGR uses as criteria. In Windows 2003, it’s a royal pain. You actually need to manually parse the events. If you are working on Windows Server 2003, Check out Kevin Holman’s blog – Using Event Description as Criteria for a Rule
Fortunately, in Windows Server 2008, this is much easier. The ‘Data Name’ fields under ‘Event Data’ in the actual event’s XML view maps directly to the corresponding Parameter number. (Yeah that makes much more sense). Let’s try this. If I open ‘Event Viewer’ and go to the ‘Security’ log and open event ‘4740’, click on the ‘Details’ tab and select ‘XML View’, I will see something similar to this: 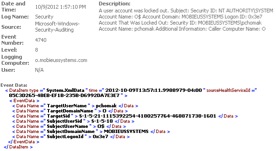
So the first entry under ‘Event Data’ is Parameter 1. The second entry is ‘Parameter 2’ and so on.
Data Name Parameter
TargetUserName ” > pchomak
TargetDomainName ” > O
TargetSid ” > S-1-5-21-1115392254-4180257764-468871738-1601
SubjectUserSid ” > S-1-5-18
SubjectUserName ” > O$
SubjectDomainName ” > MOBIEUSSYSTEMS
SubjectLogonId ” > 0x3e7
We are interested in what account was locked out (Parameter 1) and from which computer it was locked out from (Parameter 5) so now all that is left to be done is to configure the AGR to insert this data into one of the twelve available custom fields.
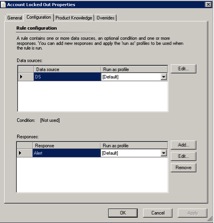
We will need to edit the appropriate AGR so go to the ‘Configuration’ tab. Under ‘Responses’ click ‘Edit’:
Now click ‘Custom Alert Fields’:
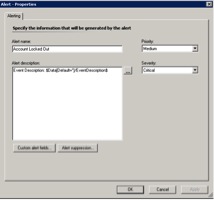
Enter the following variables:
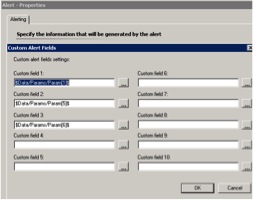
n case image is distored, the variable is $Data/Params/Param[n]$ where n is the corresponding Parameter value.
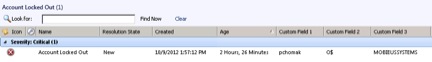
So now the locked out account will appear in Custom Field 1, the computer from where the account was locked out in Custom Field 2 and the domain the account belongs to in Custom Field 3.
So far we just discussed how to expose some additional information from the Description field. What about using that information as criteria to generate the Alert in the first place? Simple. When constructing your Data Source Expression, simply add Parameter in the correct number:
Now the Alert will only be generated if this particular user account gets locked out. Surgical not broad. The techniques described here can be used in a boat load of situations, not just security events.
Configuring E-Mail Subscriptions for Management Packs in SCOM 2012
Setting up alerts subscriptions can be a royal pain. It stems from the fact the subscriptions are uber customizable so they can seem a little confusing. Depending on your environment, you are general setting up two types of subscriptions:
Server-Centric – Alerts generated by a specific server, regardless of the management pack generating them. i.e: Any alert generated by filesrv01 is sent to file_services@mobieus.com
Service Centric – Alerts generated by a specific management pack, regardless of what server they originate from. i.e: Any alert generated from the Exchange management pack is sent to mail@mobieus.com
I always want to get information into the hands of my customers as fast as possible – its one way to expedite the management pack tuning process…by getting the alerts into the responsible group’s hands for evaluation. So I need to create subscriptions that send Alerts based on a particular management pack rather than a particular group of servers.
Here are 6 common subscriptions I use regularly: Management Pack Subscription Criteria Subcription Criteria Condition
Microsoft Windows Server Windows Server Instances Only Group ‘raised by any instance in a specific group’
Microsoft Windows Active Directory Active Directory Domain Controller Server 2008 Computer Role ‘raised by any instance of a specific class’
Microsoft SQL Server SQL Role ‘raised by any instance of a specific class’
Microsoft Exchange 2010 Microsoft Exchange 2010 All Entities Group ‘raised by any instance in a specific group’
Microsoft Windows Internet Information Services IIS Server Role ‘raised by any instance of a specific class’
With these subscriptions you can quickly and easily get the alerts into the hands of anyone you want. Coupled with an effective Alert Tuning Process your management packs will be tweaked before you know it.
Customizing Subject and Body Fields in SCOM 2012 E-Mail Notifications
More and more people are reviewing SCOM e-mail notifications on mobile devices rather than traditional desktops and laptops. The default syntax is not so much confusing as it is difficult to read. One thing I found problematic was the first part of the Subject field in the e-mail is the Name of the alert, not its Status.
Chances are the preview displayed on most mobile devices is truncated or cut off. You won’t know if the e-mail is notifying you there is a new problem or that an existing problem has been resolved. This is kinda’ a big deal if you’re the person on-call, awaken out of a sound sleep.
IMHO, first glance of a notification should reveal its status: New, Closed, Assigned etc. Good news is the change is easy:
Launch the SCOM 2012 Console / Administration / Notifications / Channels
Double-click the appropriate ‘Channel’ and click on ‘Format’
Click in the field ‘E-mail subject:’ and copy the contents into Notepad. The following is the default syntax.
Alert: $Data[Default=’Not Present’]/Context/DataItem/AlertName$ Resolution state: $Data[Default=’Not Present’]/Context/DataItem/ResolutionStateName$
It looks like a single long string but its actually two strings separated by a single space:Alert Name Status
Alert Name – Alert: $Data[Default=’Not Present’]/Context/DataItem/AlertName$
Alert Status – Resolution state: $Data[Default=’Not Present’]/Context/DataItem/ResolutionStateName$
Simply swap them:
Resolution state: $Data[Default=’Not Present’]/Context/DataItem/ResolutionStateName$ Alert: $Data[Default=’Not Present’]/Context/DataItem/AlertName$
You can also replace ‘Resolution state’ and ‘Alert’ with any description of your choosing as well as add some additional formatting. For example:
STATUS: $Data[Default=’Not Present’]/Context/DataItem/ResolutionStateName$ || PROBLEM: $Data[Default=’Not Present’]/Context/DataItem/AlertName$
The resulting e-mail subject will read:
STATUS: Closed || PROBLEM: Failed to Connect to Computer
